Insightful Analytics
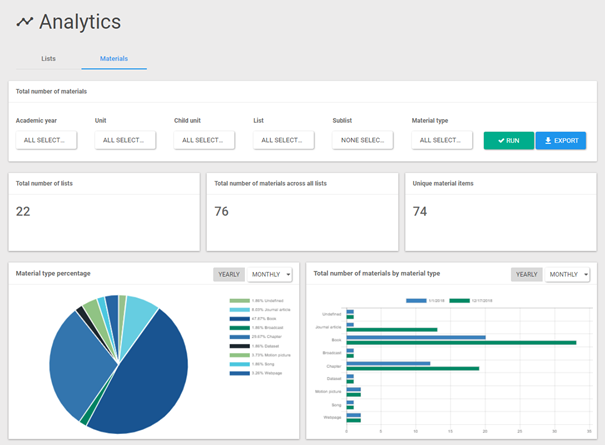
KeyLinks analytics provide immediate and valuable insight into list content and usage. Data can be filtered by year, course and module, right down to individual lists and material type, offering quick answers to questions about engagement, use and content.
The KeyLinks Visual Reporting and Analytics dashboard quickly and clearly displays key data points and information about your lists and materials. The data can also be exported to CSV or Excel using our reporting functionality.
Need something specific?
A more detailed view of KeyLinks can be found through our extensive reports library, which provides a clear view of student engagement and resources. These reports are downloadable and can be customised to suit your needs.

Benefits of KeyLinks analytics
- Gives you valuable insight into list and material usage
- Supports academics in reviewing and developing course content
- Full reporting functionality available
- Future enhancements will highlight student behaviour including when and how materials are use
